I’m not a huge fan of UML. I think it took a simple idea (standard conceptual drawings) and made it much more complex than necessary with the unwise goal of allowing commercial UML tools to flourish and make code-to-diagram round trip conversion something people might want to do. Something like MagicDraw I find horrible from a performance and usability perspective.
I’m also not a big fan of a lot of drawing software. Visio is great unless you don’t run on Windows, don’t own a copy, or care about usability. Omnigraffle on the Mac is arguably better on the usability front, but you still end up tweaking the drawing a lot more than just entering your relationships and drawing connections. With any drawing software, the saved file is not human readable - and looking at diffs in a source control system tells you nothing
I like Graphviz for making quick drawings that are minimalistic and take away the tweaking factor of a lot of apps. You describe the nodes and edges and Graphviz figures out how to handle the layout of the drawing. Need to add something later? No problem, just put it in the dot file and regenerate your results.
Graphviz has the advantages of:
- Runs everywhere
- Free
- Text based - diff friendly changes
- Supports a wide variety of output formats: bmp, eps, fig, gd, gd2, gif, gtk, ico, imap, cmapx, jpg, pdf, plain, png, ps, svg, tiff, vml, vrml, wbmp, webp, xlib
Graphviz’s disadvantages:
- Sometimes the layout is less than perfect
- The output is pretty plain unless you spend a lot of adding style in the dot (which hurts the simplicity of the input format). Or spend time tweaking the output format (which gets you back into the image software trap)
- Doesn’t support UML style graphics
For a long time graphviz supported the inclusion of PostScript files to define shapes, but this was only useful if you were outputting PostScript as a final result. I like using SVG as my format of choice since it can be freely scaled and works in most web browsers these days. Looking around the other day, I found a reference to the fact that Graphviz also supports the inclusion of SVG files as an image format. With a little experimentation, I found that it works pretty well.
First, I created a series of UML images in SVG format for inclusion. The full set is in the GitHub project referenced below, but an example for a Component icon looks like this:
<?xml version="1.0" encoding="UTF-8" standalone="no"?>
<svg
   xmlns:svg="http://www.w3.org/2000/svg"
   xmlns="http://www.w3.org/2000/svg"
   xmlns:xlink="http://www.w3.org/1999/xlink"
   version="1.1"
   width="91"
   height="36"
   id="component-svg">
   <defs>
     <symbol id="component-badge" class="badge" preserveAspectRatio="xMaxYMin" viewBox="-1 -1 14 12" style="fill:#ffffff;stroke:#000000;stroke-width:0.75">
        <rect height="10" width="10" x="3" y="0"/>
        <rect height="2" width="6" x="0" y="2"/>
        <rect height="2" width="6" x="0" y="6"/>
      </symbol>
    </defs>
    <g>
      <rect
           height="35"
           width="90"
           y="0"
           x="0"
           class="umlbox"
           style="fill:#ffffff;stroke:#000000;stroke-width:1;"/>
        <use x="72" y="4" xlink:href="#component-badge" width="15" height="11"/>
   </g>
</svg>
Then you can create a file describing your Component Diagram which looks like this:
digraph SampleComponentDiagram {
  label="Sample Component Diagram";
  fontname="Helvetica";
  fontsize="10";
  node [fontname="Helvetica",fontsize="10",shape=none];
  edge [arrowhead="vee",style="dashed",color="#003388",fontname="Helvetica",fontsize="8"];

  rankdir=LR;

  subgraph cluster0 {
    style=filled;
    color="#2b6f6f";
    fillcolor="#fc93cb";
    label = "Web Application";

    portal [label="Customer\nPortal", image="portal.svg"];

    // Services
    payment [id="payment",label="Payment",image="service.svg"];
    user [id="user",label="User",image="service.svg"];
    product [id="product",label="Product",image="service.svg"];
  }

  subgraph cluster1 {
    style=filled;
    color="#2b6f6f";
    fillcolor="#96f4eb";
    label = "Backend";

    billing [id="billing",label="Billing API",image="service.svg"];

    // Databases
    sqlServer [label="SQL\nServer",image="database.svg"];
    riak [label="Riak",image="cloud.svg"];

    // Components
    loggingJournal [label="Logging\nJournal",image="component.svg"];
    watchdog [label="Watchdog",image="component.svg"];
    eventQueue [label="Event ActiveMQ",image="queue.svg"];

    // Portals
    supportPortal [label="Support\nPortal", image="portal.svg"];
    riakAdmin [label="Riak\nAdmin\nWeb\nPortal",image="portal.svg"];
  }

  subgraph cluster3 {
    label = ""
    color="none";
    customer [label="Customer",image="user.svg"];
    apiClient [label="API Client",image="user.svg"];
  }

  devOps [label="DevOps", image="user.svg"];

  // Connections
  customer->portal;

  apiClient->payment;
  apiClient->user;
  apiClient->product;

  watchdog->riak;
  watchdog->billing;
  watchdog->supportPortal;
  watchdog->payment;
  watchdog->user;
  watchdog->product;

  devOps->riakAdmin;
  devOps->supportPortal;

  riakAdmin->riak;

  payment->eventQueue;
  product->eventQueue;
  user->eventQueue;

  eventQueue->billing;

  billing->sqlServer;
  billing->loggingJournal;

  loggingJournal->riak;
}
Running the file through graphviz like this:
dot -Tsvg -O sample.dot
Results in an image that looks like this:
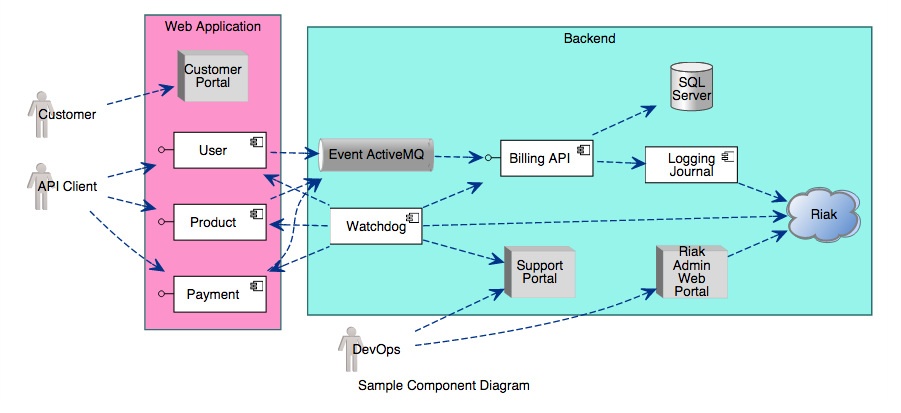
Which is not too bad of a start. From here, there’s a few things I think I could do to make it even better.
- Pre-process the dot file. Come up with an annotation to denote the type of image to include for a node without having to reference the image file.
- Assign ids and classes as appropriate in the output which is handy for animating the resulting SVG or otherwise working with the SVG DOM later.
- Post-process the SVG output to look nicer. Apply a better look to the sub-graphs, round the corners, add add gradients, etc. This sort of thing has been done before with XSLT.
I think this approach is reasonable for some UML types: component, use case, collaboration, activity, and maybe deployment. Sequence diagrams are different in layout and probably aren’t worth the effort to attempt.